FranchiseVerdict

3,063 brands with an FDD on file · 18 categories

Browse 3,063 franchise brands

Every brand with an FDD on file, graded. Sorted best-rated first.

See them plotted on The Franchise Matrix

How we count: 4,187 brands published — 3,063 with an FDD on file (these carry a grade) and 1,124 with SBA lending data only (no grade). 3,016 distinct FDD filings; 145,362 SBA loan records. Counts as of 2026-11-15.

Latest FDD per brand (year on each brand)SBA 7(a) data through FY2026Updated How we score

Brand results

View Christie’s International Real Estate details
Christie’s International Real Estate logo
Christie’s International Real Estate

Investment
$64K – $443K
Avg gross sales
Not disclosed
Units
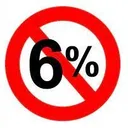
40+6%
SBA 7(a) charge-off
Not SBA-matched
Real Estate
2026 FDD
View 1 Percent Lists details
1 Percent Lists logo

1 Percent Lists

Investment
$10K – $61K
Avg gross sales
Not disclosed
Units
51+32%
SBA 7(a) charge-off
Not SBA-matched
Real Estate
2026 FDD
View Svn details
SVN logo

Svn

Investment
$37K – $124K
Avg gross sales
Partial, no average
Units
115-17%
SBA 7(a) charge-off
14 loans: too few to judge
Real Estate
2026 FDD
View Intero Real Estate Services / Intero Resorts details
Intero Real Estate Services / Intero Resorts logo

Intero Real Estate Services / Intero Resorts

Investment
$210K – $855K
Avg gross sales
Not disclosed
Units
40-21%
SBA 7(a) charge-off
Not SBA-matched
Real Estate
2025 FDD
View Weichert Realtors details
Weichert Realtors logo

Weichert Realtors

Investment
$77K – $360K
Avg gross sales
Not disclosed
Units
338-14%
SBA 7(a) charge-off
Under 10 loans (9)
Real Estate
2026 FDD
View William Raveis details
William Raveis logo

William Raveis

Investment
$75K – $281K
Avg gross sales
Not disclosed
Units
136-54%
SBA 7(a) charge-off
Not SBA-matched
Real Estate
2025 FDD
View New Again Houses details
New Again Houses logo

New Again Houses

Investment
$127K – $208K
Avg gross sales
Partial, no average
Units
49+20%
SBA 7(a) charge-off
Not SBA-matched
Real Estate
2025 FDD
View Realty Executives details
Realty Executives logo

Realty Executives

Investment
$53K – $431K
Avg gross sales
Not disclosed
Units
258-14%
SBA 7(a) charge-off
12 loans: too few to judge
Real Estate
2025 FDD
View 360 Tour Designs details
360 Tour Designs logo

360 Tour Designs

Investment
$66K – $77K
Avg gross sales
$62K
Units
15-20%
SBA 7(a) charge-off
Not SBA-matched
Real Estate
2025 FDD
View Hommati details
Hommati logo

Hommati

Investment
$64K – $74K
Avg gross sales
$155K
Outlet subset
Units
117-16%
SBA 7(a) charge-off
Under 10 loans (5)
Real Estate
2026 FDD
View Commercial Investors Group details
Commercial Investors Group logo

Commercial Investors Group

Investment
$123K – $314K
Avg gross sales
$5.2M
Company-owned only1 outlet
Units
3
SBA 7(a) charge-off
Not SBA-matched
Real Estate
4+ yrs2022 FDD
View 1st Class Real Estate details
1st Class Real Estate logo

1st Class Real Estate

Investment
$50K – $159K
Avg gross sales
$588K
Units
70-34%
SBA 7(a) charge-off
Not SBA-matched
Real Estate
2026 FDD
View HomeTeam details
HomeTeam logo

HomeTeam

Investment
$65K – $92K
Avg gross sales
$313K
Units
191-4%
SBA 7(a) charge-off
~35.7%(n=14 resolved)
Real Estate
2026 FDD
View Estate 360 details
Estate 360 logo

Estate 360

Investment
$70K – $107K
Avg gross sales
Partial, no average
Units
2
SBA 7(a) charge-off
Not SBA-matched
Real Estate
2025 FDD
View EXIT Realty details
EXIT Realty logo

EXIT Realty

Investment
$75K – $216K
Avg gross sales
Not disclosed
Units
518-13%
SBA 7(a) charge-off
Under 10 loans (6)
Real Estate
2025 FDD
View Gorilla Property Services® details
Gorilla Property Services® logo

Gorilla Property Services®

Investment
$129K – $215K
Avg gross sales
Partial, no average
Units
1
SBA 7(a) charge-off
Not SBA-matched
Real Estate
2025 FDD
View Morrison Plus Property Inspections details
Morrison Plus Property Inspections logo

Morrison Plus Property Inspections

Investment
$44K – $83K
Avg gross sales
Partial, no average
Units
11
SBA 7(a) charge-off
Not SBA-matched
Real Estate
4+ yrs2022 FDD
View Mossy Oak Properties details
Mossy Oak Properties logo

Mossy Oak Properties

Investment
$20K – $72K
Avg gross sales
Not disclosed
Units
87-15%
SBA 7(a) charge-off
Not SBA-matched
Real Estate
2024 FDD
View Better Homes and Gardens Real Estate details
Better Homes and Gardens Real Estate logo

Better Homes and Gardens Real Estate

Investment
$34K – $269K
Avg gross sales
Not disclosed
Units
362-10%
SBA 7(a) charge-off
Not SBA-matched
Real Estate
2026 FDD
View Blue Diamond Sales & Rentals details
Blue Diamond Sales & Rentals logo

Blue Diamond Sales & Rentals

Investment
$32K – $45K
Avg gross sales
Partial, no average
Units
2
SBA 7(a) charge-off
Not SBA-matched
Real Estate
2025 FDD
View Cait’s Estate Sales details
Cait’s Estate Sales logo

Cait’s Estate Sales

Investment
$82K – $111K
Avg gross sales
Partial, no average
Units
2
SBA 7(a) charge-off
Not SBA-matched
Real Estate
2026 FDD
View Loyalty Business Brokers details
Loyalty Business Brokers logo

Loyalty Business Brokers

Investment
$53K – $89K
Avg gross sales
Not disclosed
Units
4
SBA 7(a) charge-off
Not SBA-matched
Real Estate
2025 FDD
View The Inspection Boys® (Area Representative) details

The Inspection Boys® (Area Representative) logo

The Inspection Boys® (Area Representative)

Investment
$155K – $313K
Avg gross sales
Not disclosed
Units
1
SBA 7(a) charge-off
Not SBA-matched
Real Estate
2025 FDD
View AcuSpray details
AcuSpray logo

AcuSpray

Investment
$148K – $328K
Avg gross sales
Not disclosed
Units
1
SBA 7(a) charge-off
Not SBA-matched
Real Estate
2024 FDD

The letter is the verdict grade, A (strongest tier) to F (weakest tier): an editorial assessment from public filings, not investment advice. The strip beside it is the A to F scale from low to high, each grade as wide as its score range, with a tick at the brand's verdict score (0 to 100, higher is better). Avg gross sales is the figure each FDD's Item 19 reports; the basis varies by brand (gross sales, net sales or another metric), and gross sales are not profit. SBA 7(a) charge-off is the share of resolved SBA loans that were charged off; lower is better. The year is the FDD the figures come from; an older filing may be out of date. A chip under the figure qualifies it: Outlet subset (reported for some outlets, not the whole system), Combined outlet types, Company-owned only, Incl. company outlets, Partial period (not a full year), or Per franchisee, not per outlet. Limited data means fewer than 42 of the fields we track are filled for that brand.

Next step

  • Pro

    For advisors and lenders working across many brands; inquire by email.